Monday, March 28, 2011

Documenting Badboy Scripts

Today I thought I would write about something that many people would rather avoid, but which can be essential in larger projects – making documentation that explains what your test scripts are doing and how and why they work.

Why Write Documentation?

For someone starting out or working on a relatively simple project, making documentation can seem like a bit of a nicety rather than a “must have”.   However, as anyone who engages in a non-trivial amount of quality assurance work knows, your library of automated test scripts soon represents a significant value that needs to be preserved and understood by more people than just yourself, or even your team.   Sometimes it even needs broader exposure to people who understand automated testing tools.

This problem was brought home to me recently very sharply when I engaged in a project to build FDA regulated software for managing medical images and health records.   All of a sudden the problem of correctly documenting QA assets goes from being a nicety to a necessity mandated by law.   In this kind of situation it is not good enough that tests exist – they have to be “seen” to exist, traced to requirements and even be able to be understood by external third parties such as an auditor.  During this project several lesser known features of Badboy proved extremely useful for helping to keep these problems under control and, to my surprise, they turned out to be useful beyond just the purpose of automated testing and as a general library of information about how to navigate and use the web application.

Adding Documentation to Your Scripts

Every item in a Badboy script automatically gets a field for documentation text that can be used to write notes about what it does, how it works, which requirements it is testing or what bugs are related to it.  This text is completely free form and supports simple formatting such as bold, underline, italics and bullet lists.   It also supports adding links to external content so that you can easily open up any web based resource that might be related such as a wiki, project management software or a bug tracker straight from Badboy.
There are several shortcuts for adding documentation that make it a bit easier.   The simplest is just to select the item in the Script Tree and press Ctrl+Shift+D.  This will pop you straight into the Documentation section of the item ready to start typing.  From there you can type to your heart’s content:
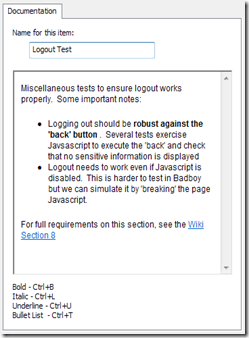
image
To create links in your text, select the text and then press Ctrl+K and a small window will pop up to let you enter the URL that you want to point the link at.

Using Documentation

Once you’ve added some documentation, Badboy uses that documentation in several ways.  The most obvious is that it shows the documentation in the Summary pane inside Badboy so that it’s always there for quick reference as you scan your script:
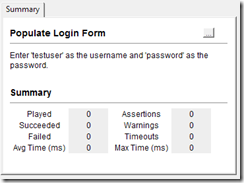
image
A much more interesting use of the documentation comes, however, when you Export it using Badboy’s Export HTML Documentation feature which is found in the “Save As” menu.
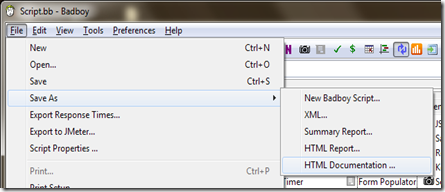
image
Upon exporting like this we get a nicely formatted report showing all of our Steps with excerpts from the documentation included for reference:
image

This is a nice simple HTML document that you can save on your hard drive, email to your boss, or – perish the thought – even print out and put in a filing cabinet!

An intriguing about this kind of export is that not only is it nice documentation about the test, but (assuming you documented it well), it contains most of the essential information for a manual tester to reproduce the test.   This means that you can grab any test you like, export documentation, print it out, and you have in your hand something that a human being can process to perform the test.    This raises a rather interesting possibility of reversing the usual process of writing test specifications – why write a test plan, then implement it with Badboy, when you could do it the other way?  Record your test, add documentation and export it and there you have your test specification!

As counter-intuitive as it seems, there are lots of reasons to like having human readable and manually executable versions of your automated test scripts.    The simple fact is, as useful as automated tests are, they are never as good as a real person carefully looking at the page and assessing it.    Of course you want to offload as much of your manual testing into automated means as you can – but when you need to look deeper – whether it is because things are failing and you need to know why, or whether it is because you just want to do a “final” pass check, having a way to export your test sequence in a human readable form is extremely powerful.
In Conclusion …

These documentation features of Badboy are, in my opinion, greatly under utilized.   The world would be a better place if more people made more documentation of their test scripts.   I would love to hear via the Badboy Feedback Page or comments how usable people find the documentation features of Badboy to be and what we could do to make them even easier to work with.

Sunday, March 20, 2011

Mobile Access to Wave Test Manager

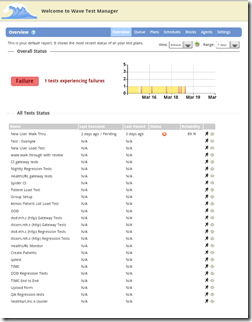
If you have ever tried to use Wave Test Manager from a smart phone such as an iPhone or Android device you will probably have noticed that while it’s functional it is far from optimized for the mobile experience.  Probably it comes up looking something like this:
image
Fortunately there is some good news for smart phone junkies who are also Wave Test Manager users – the next version of Wave Test Manager (1.1) will ship with an optional, mobile optimized interface that you can use to view and manage your tests.  The mobile optimized version of this page is far more finger friendly and usable:

image

Tapping on on one of the Test Plans will bring you a nice graphical view of the Test Plan showing how it has been running and more options:

image

Not only is this interface much easier to use from a mobile device, it is also much faster due to being built to take advantage of HTML5 Offline Caching abilities of phone browsers1.    This even lets you browse your tests if you don’t have a network connection (although it won’t get the latest status from the server unless you’re connected, obviously).   The pages are also designed to work well when you save shortcuts to them to the home screen – in which case they will get nice shortcut icons, use the whole screen and behave similarly to native apps in other ways.

These interfaces are still under development but you can start using an early version which will be included in the next beta for Wave Test manager 1.1 quite soon.   For now the focus is iPhone and Android compatibility, but if you use different devices, tell us at the Feedback Page so we know where the demand is for support on other platforms.

1 Unfortunately the latest iOS update broke some capabilities of web apps on iOS devices such as the iPhone and iPad.   Hopefully Apple will fix these problems soon.

Monday, March 14, 2011

Using Badboy and Ant Together

As more and more people use Badboy and integrate it into their development and testing workflows a question that has been becoming more and more frequent has been “how do I build Badboy into my automated build scripts so that it can run as part of my normal build process?”   This question becomes even more important when you attempt into integrate Badboy into a continuous integration environment such as Hudson (or Jenkins, as it is now called).

The good news is that with the latest versions of Badboy (as of this writing, Badboy 2.1.1 and up) using Badboy with one build tool -  Ant – just got a lot easier.    In fact, even if you use a different build tool, new features in Badboy 2.1.1 will help you better integrate Badboy into your workflows because there are new command line options for Badboy that significantly streamline the process.   However this post will focus on support for Ant as this extremely common build tool now has direct support via some very handy Ant plugin tasks that make it extremely simple to integrate Badboy.

Getting Started

To get started with using the Badboy Ant plugin you first need to download the jar file containing the plugin tasks and place them in your Ant “lib” directory.  For example, if you have Ant installed at “C:\programs\apache-ant-1.8.2”, then place the jar file in “C:\programs\apache-ant-1.8.2\lib”.   There are other ways to do it but this is the simplest and most tried and true method.  
Once you have the jar file installed you have to do just one more thing to your build file before you can use the Badboy Ant tasks – just add two taskdefs at the top of your build file (right after the project tag) like so:
<taskdef name="runscript" classname="com.badboy.ant.RunScriptTask"/>
<taskdef name="runTestPlan" classname="com.badboy.ant.WTMTask"/>

Once you’ve done this you’re ready to use the tags just like any other inside your build file.

Using the RunScript Tag


Once you’ve declared the tasks putting the tags to use is easy.  Running a simple script using Badboy on the same computer as the build script is running is, in fact, just a single tag:
<runscript script="test.bb"/>

This will fire up Badboy and cause it to run the script from beginning to end without stopping.  All the niceties such as auto-dismissing popups, Javascript errors or other problems that might cause the script to halt midstream are taken care of for you.   In addition, if the script has errors or assertion failures it will cause the build to fail and abort – just as if you had introduced a compile error or a normal unit test failure!

If you prefer different behavior you can stop the build from failing when a script fails by simply adding a failOnError attribute and setting it to false:

<runscript script="test.bb" failOnError="false"/>

If you want to pass variables to your script then you can easily add them as child elements:

<runscript script="test.bb">
  <var name="foo">bar</var>
  <var name="cat">dog</var>
</runscript>

Using the Wave Test Manager Tag

The RunScript tag is simple and easy to use, but it has one glaring disadvantage: it runs the script on the same computer as that where the build script itself is running. This may not be a problem in some situations but there are a range of scenarios where it just doesn’t work at all – perhaps you like to do useful work while your build is running and don’t like a giant Badboy window popping up in the middle of the build, or perhaps you need to run multiple builds concurrently and having many Badboy instances popping up together causes problems – or perhaps you want to support developers who aren’t using Windows and can’t run Badboy at all. All these issues are easily dealt with using Wave Test Manager and the runTestPlan task. Before you can do this, of course, you need to install Wave Test Manager somewhere – anywhere will do, including on the same computer as the build is running on. For the purpose of this post, I’ll assume that you have the server running on a server called “wave.acme.com” – but it could be on any computer, the build script doesn’t care. Assuming you’ve got a live Wave Test Manager server, running your script is once again, just a single tag:

<runtestplan name="Example" server="wave.acme.com:8030"/>

There are some differences to how this task works to the previous one that need to be noted. Firstly, with Wave Test Manager, you don’t run script files directly but rather Test Plans which are essentially just a list of scripts with preconfigured settings for how they should run. So instead of specifying a script file name now you are specifying a Test Plan name that matches the name one of your Test Plans in Wave Test Manager.

Another important difference is that instead of pausing while the test plan executes, the build will, by default, continue on in parallel while the test executes, and the build script will not fail if the script has errors or assertion failures. The reasoning here is that a script scheduled to run in Wave Test Manager is simply placed in queue and there is not a guarantee that it will begin executing straight away – that depends on the availability of a Badboy Agent to run the script. Wave Test Manager also supports its own notification mechanisms to tell you about script failures so you don’t necessarily need a build failure to tell you about it.

However if you prefer your build script to wait while the script executes and fail when it fails, you can add attributes to make that behaviour occur:
<runtestplan name="Example" server="wave.acme.com:8030" waitFor="true" failOnError="true"/>

Now your build will patiently wait until the script finishes executing and it will fail the build if any of the scripts in the Test Plan has errors or assertion failures.

Summary

Hopefully these Ant tasks will make integrating Badboy into automated builds much easier and help Badboy users streamline execution of their test scripts. Of course, there are many other build tools out there and many more features that could be added to these tags as well, so let us know what you want at the Badboy Feedback Page and we’ll endeavour to oblige!